Examining The Roots of Environmental Injustice in Minneapolis
This interactive dashboard allows you to explore the legacy of residential segregation, one that has led to stark environmental injustice that tremendously ails Black, Latino, and Native American families in Minneapolis.
A Closer Look
Let’s take a closer look at how residential segregation correlates with the disparity in social vulnerability index*, temperature, and air pollution in different Minneapolis neighborhoods.
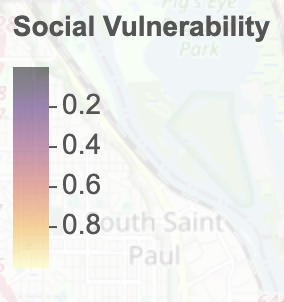
**The current CDC/ATSDR Social Vulnerability Index uses 16 U.S. Census variables from the 5-year American Community Survey (ACS) to identify communities that may need support before, during, or after disasters. These variables are grouped into four themes that cover four major areas of social vulnerability and then combined into a single measure of overall social vulnerability.*
First, we will look at the uneven distribution of social vulnerability score in Minneapolis as a result of racial covenants and redlining.
Neighborhood who are less socially vulnerable tend to reside in better HOLC grade neighborhoods with dense concentrations of racial covenants.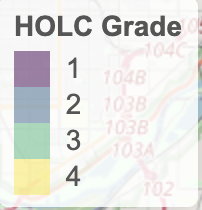
Yet, social vulnerability score is much higher in areas that were viewed as “undesirable”–where there were little to no racial covenants.
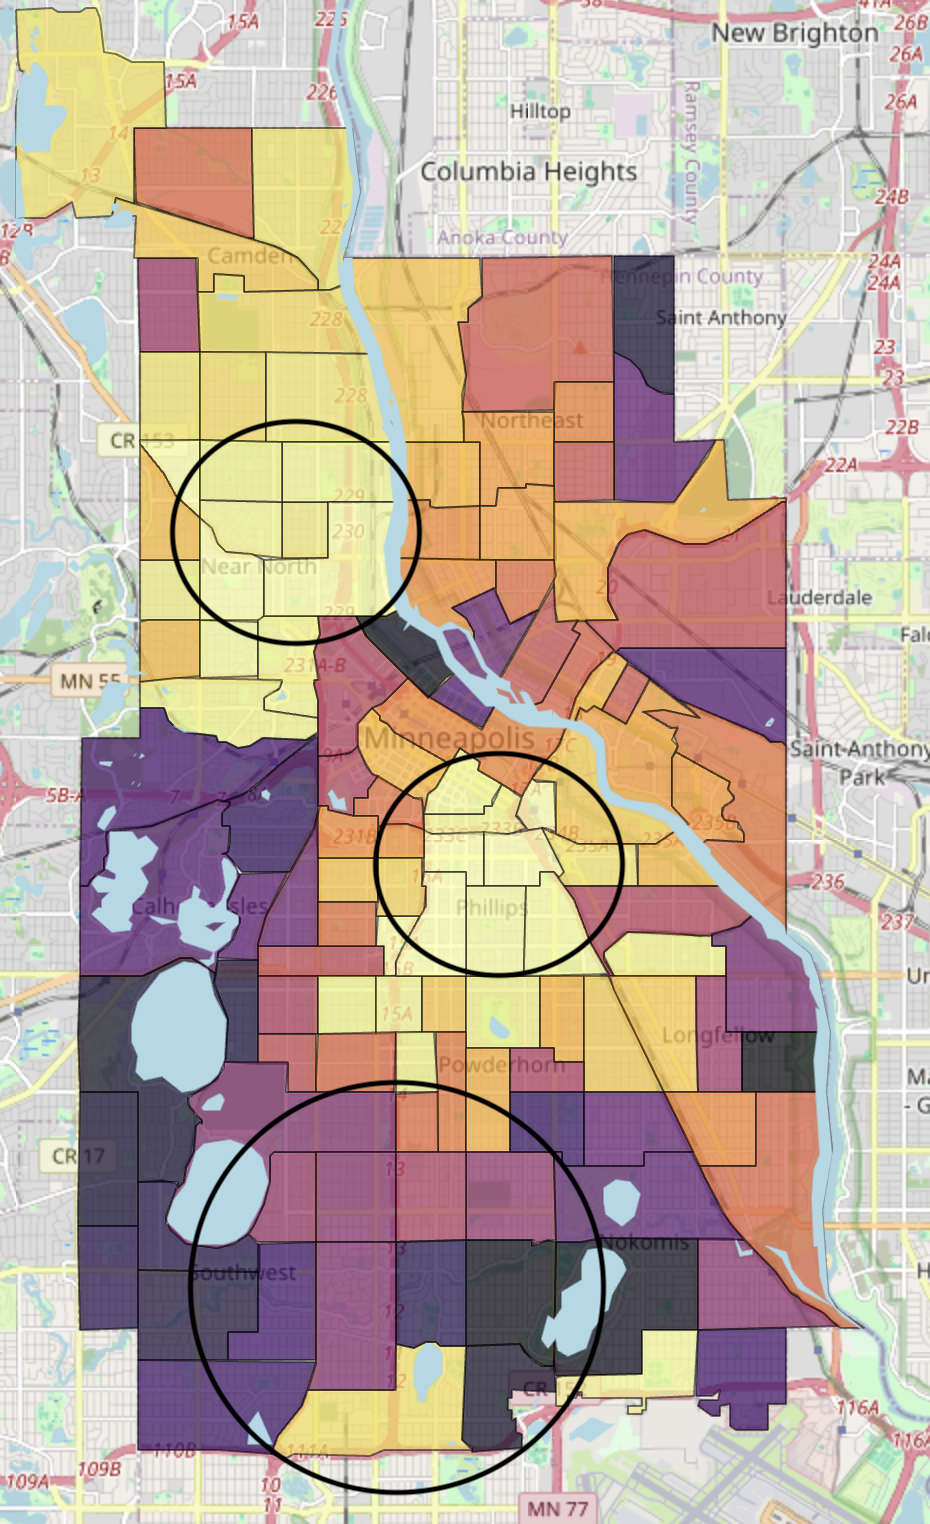
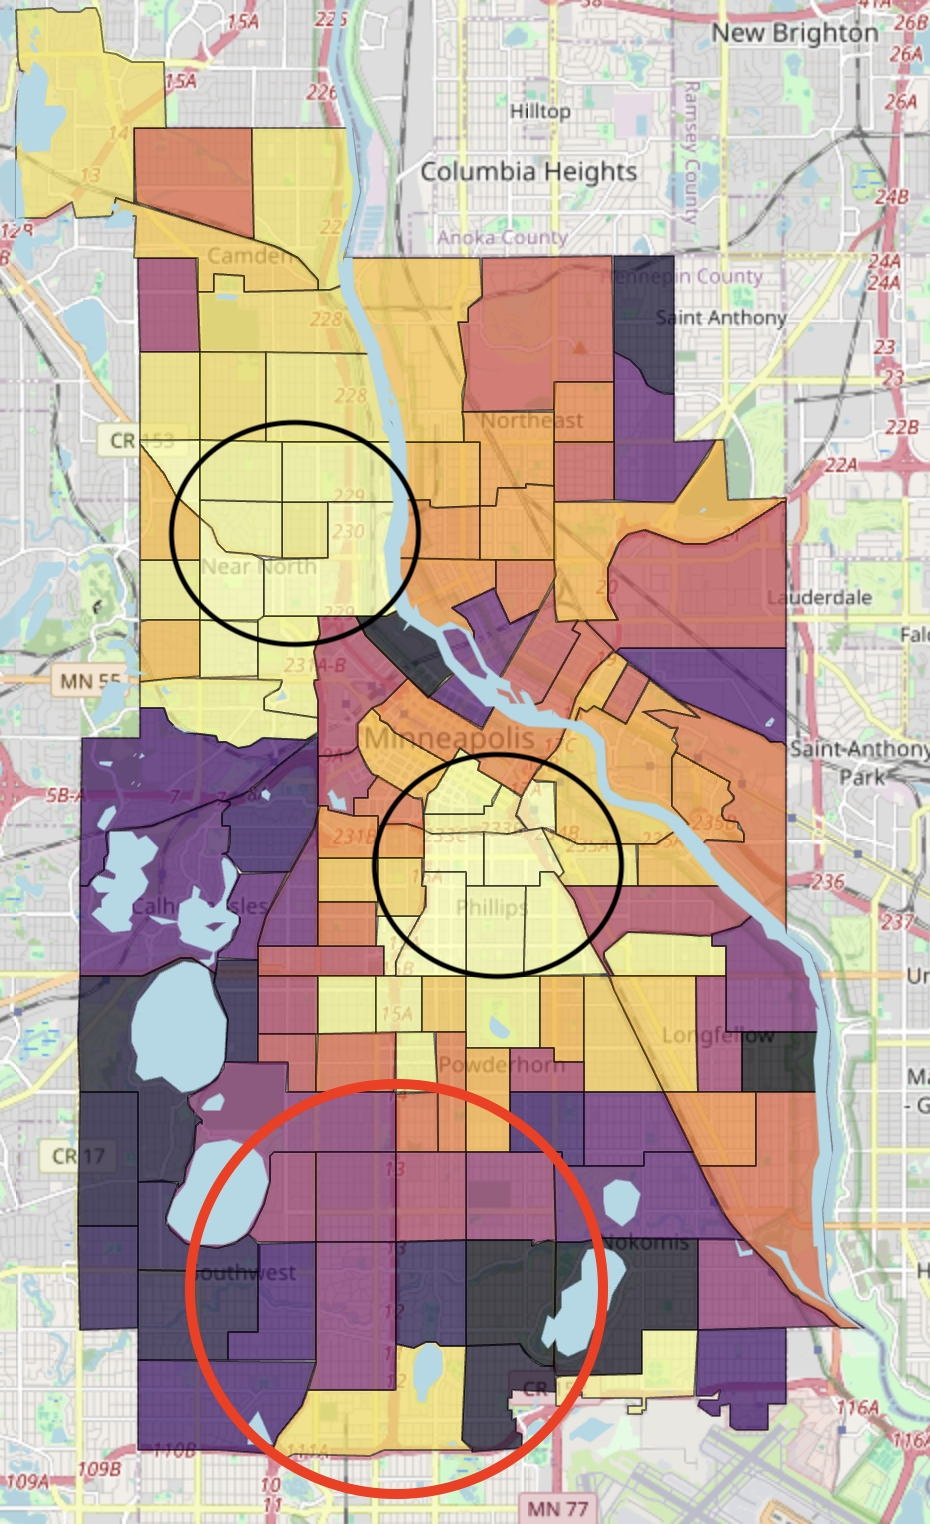
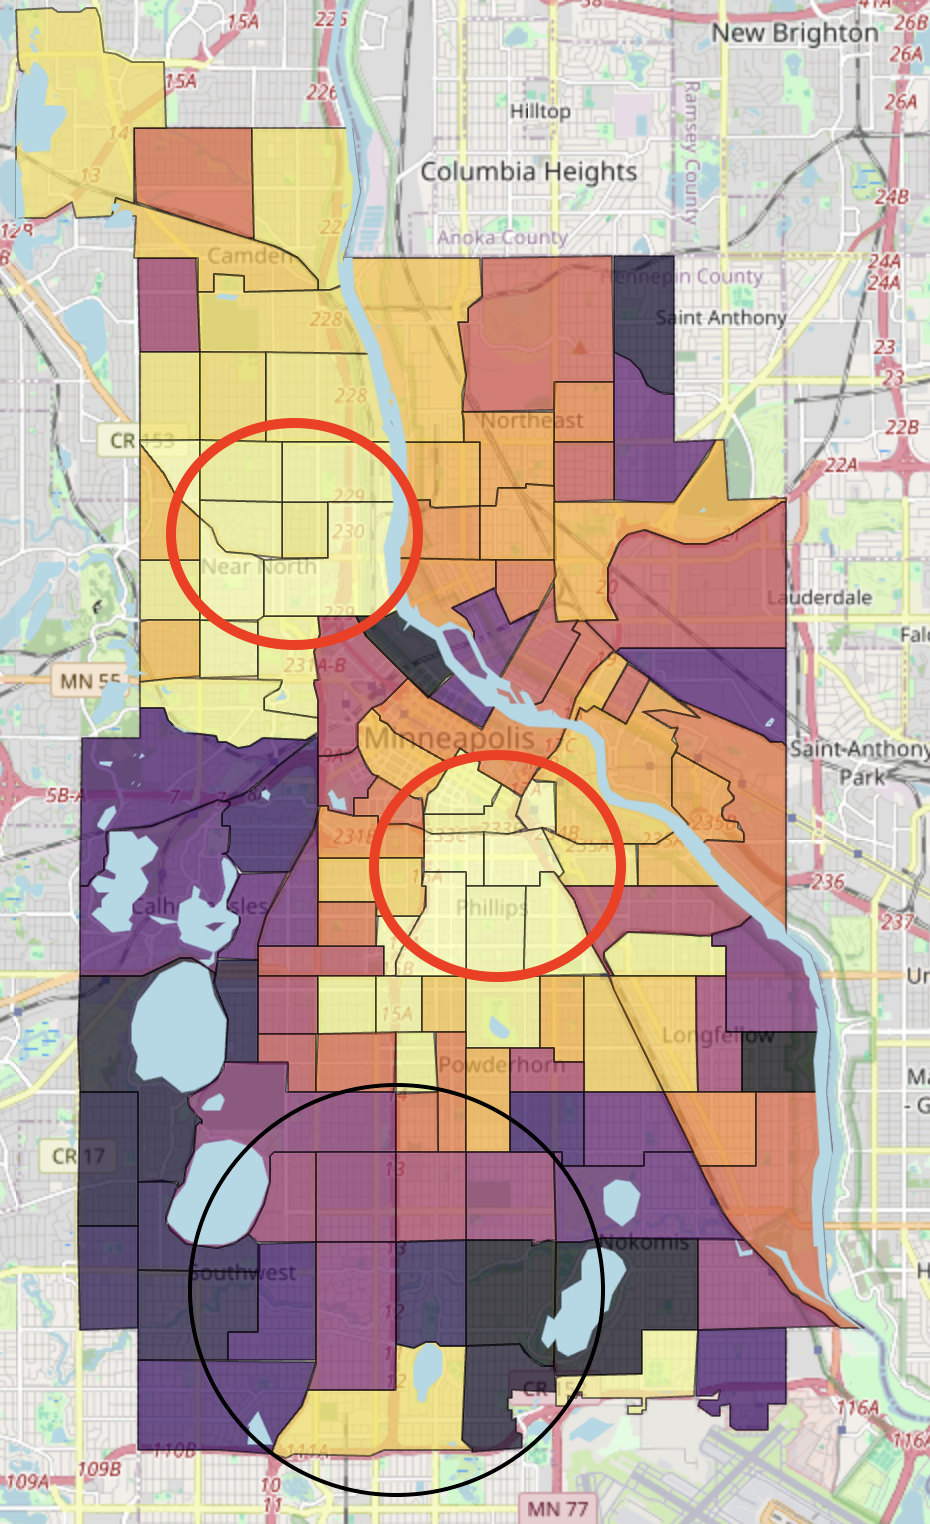
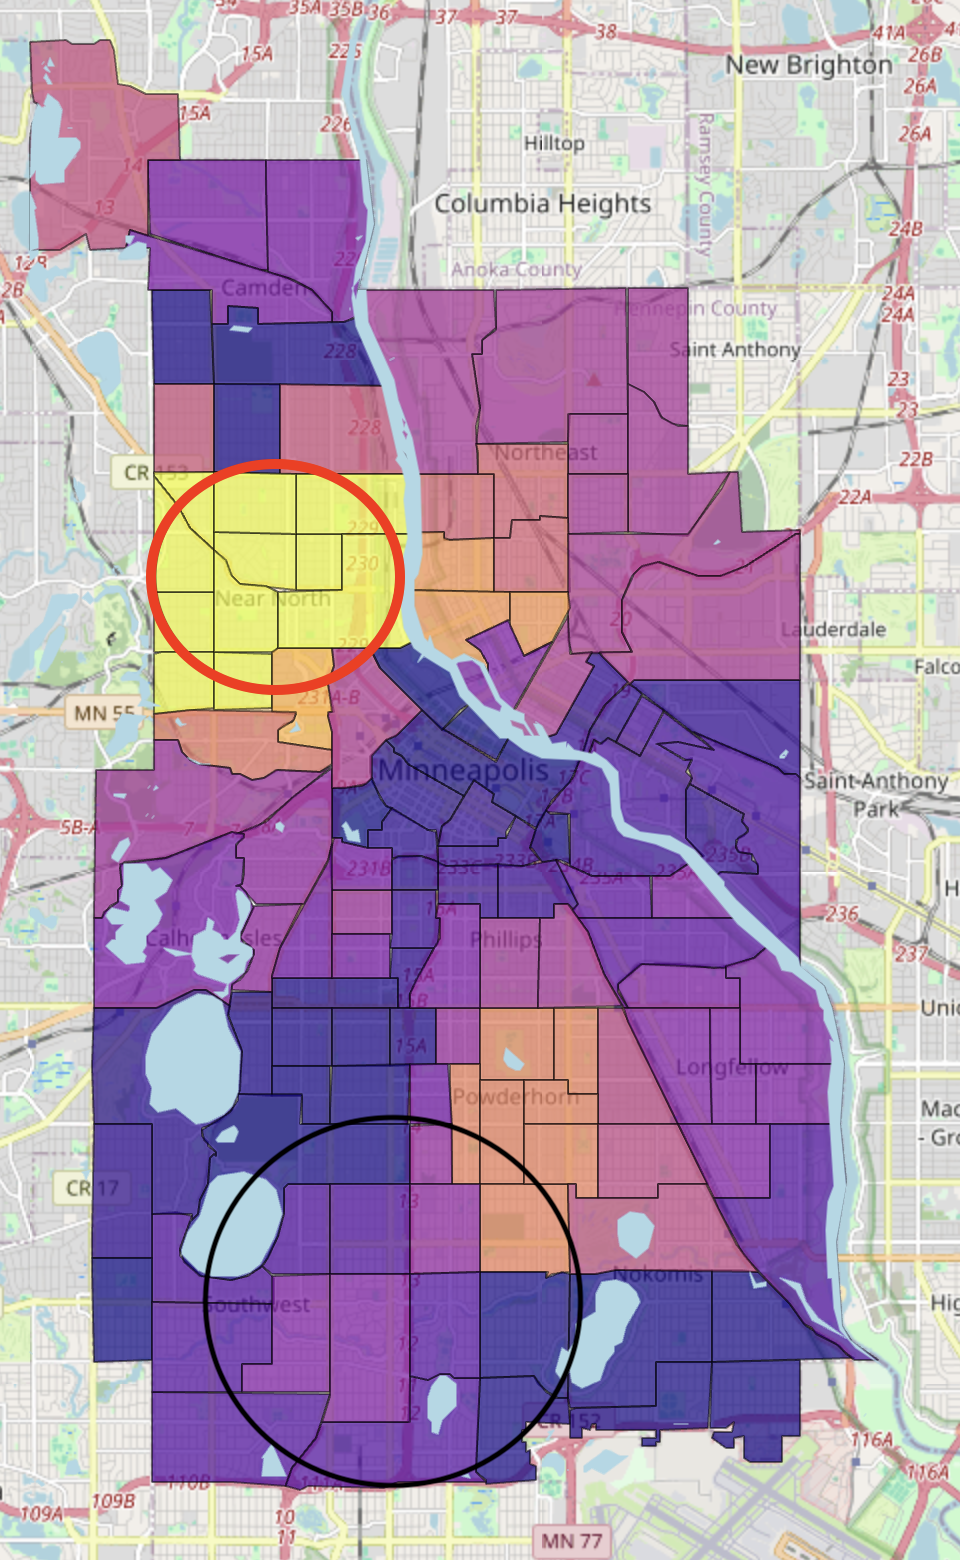
Now, we will see how land surface temperature differ in different Minneapolis neighborhoods as a result of racial covenants and redlining.
In better HOLC grade neighborhoods with dense concentrations of racial covenants, today’s land surface temperature is markedly lower.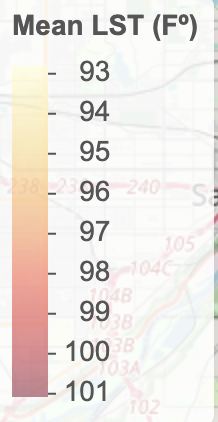
Contrastly, land surface temperature is remarkably higher in areas that were deemed as “declining”, “hazardous”, and “undesirable”–areas where there were little to no racial covenants.
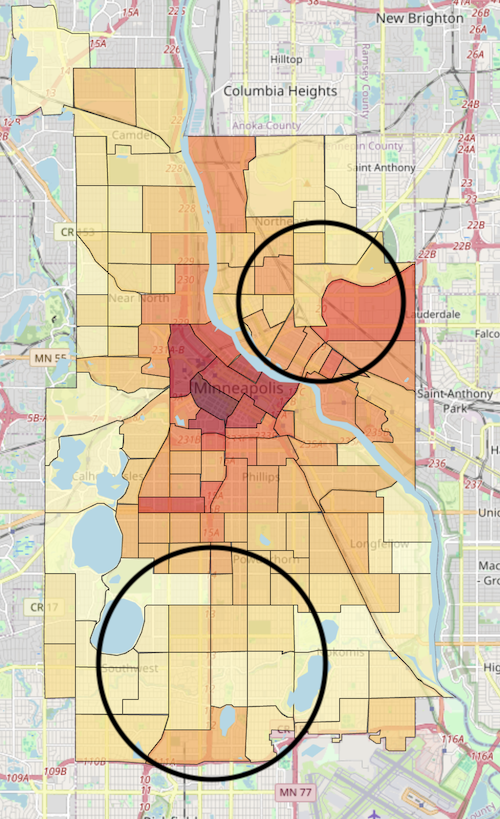
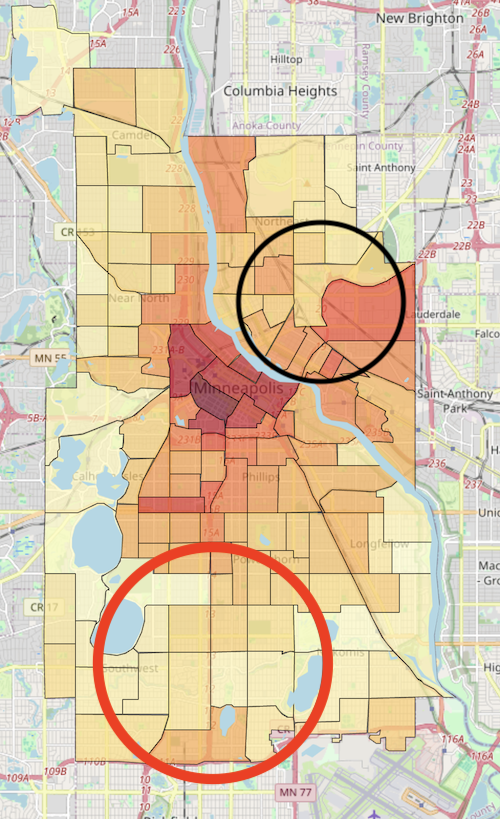
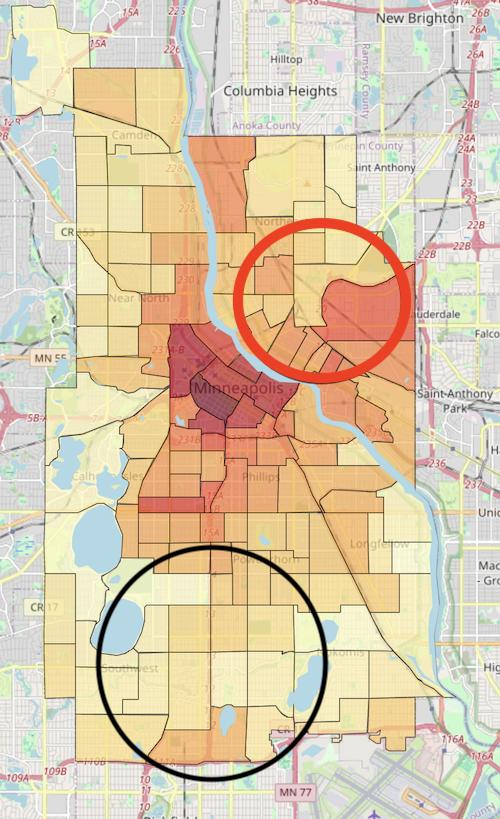
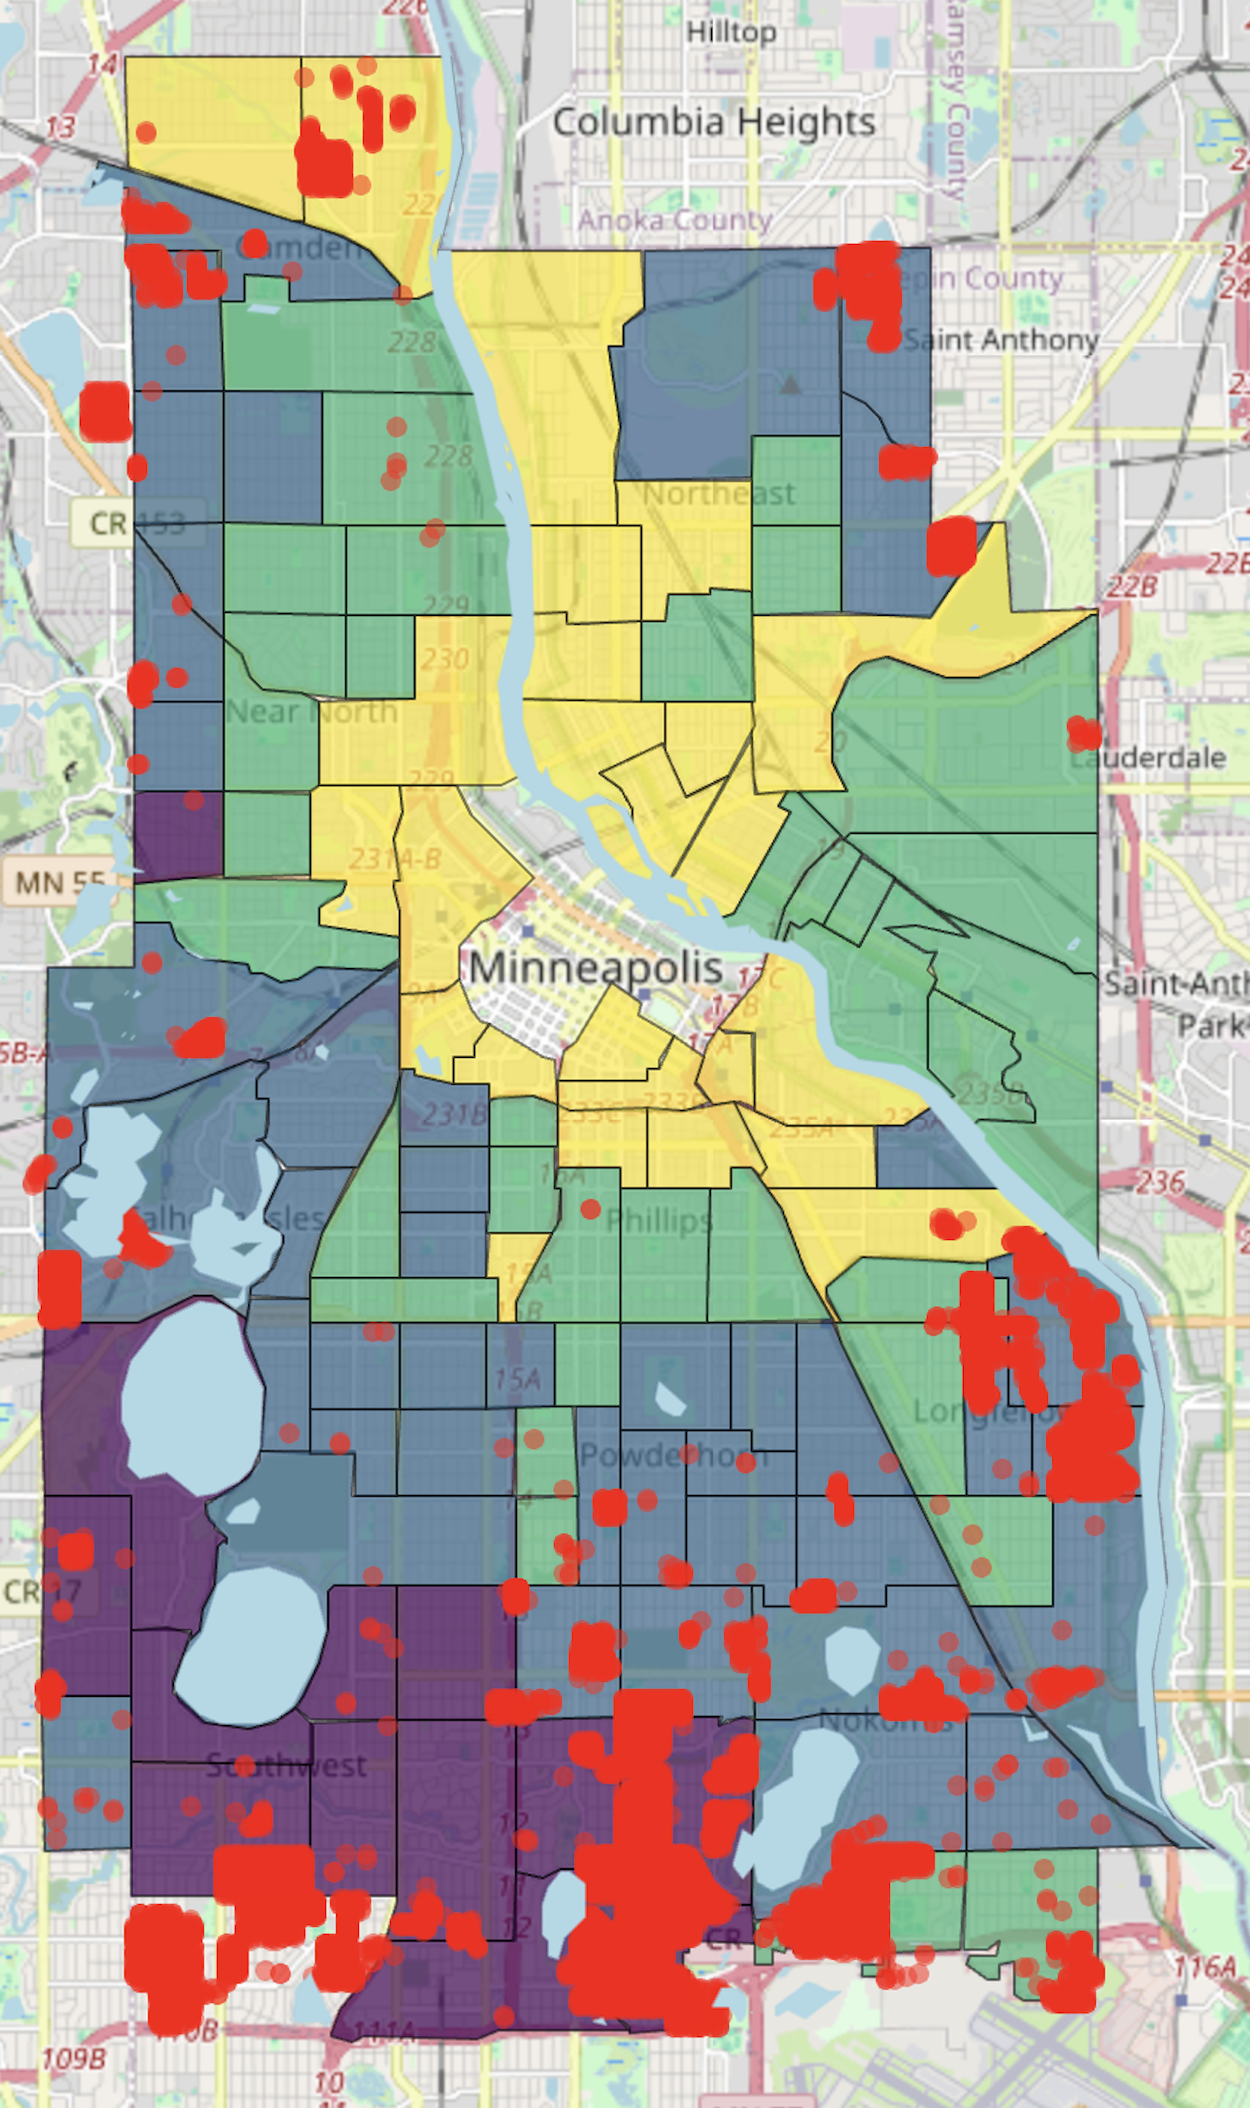
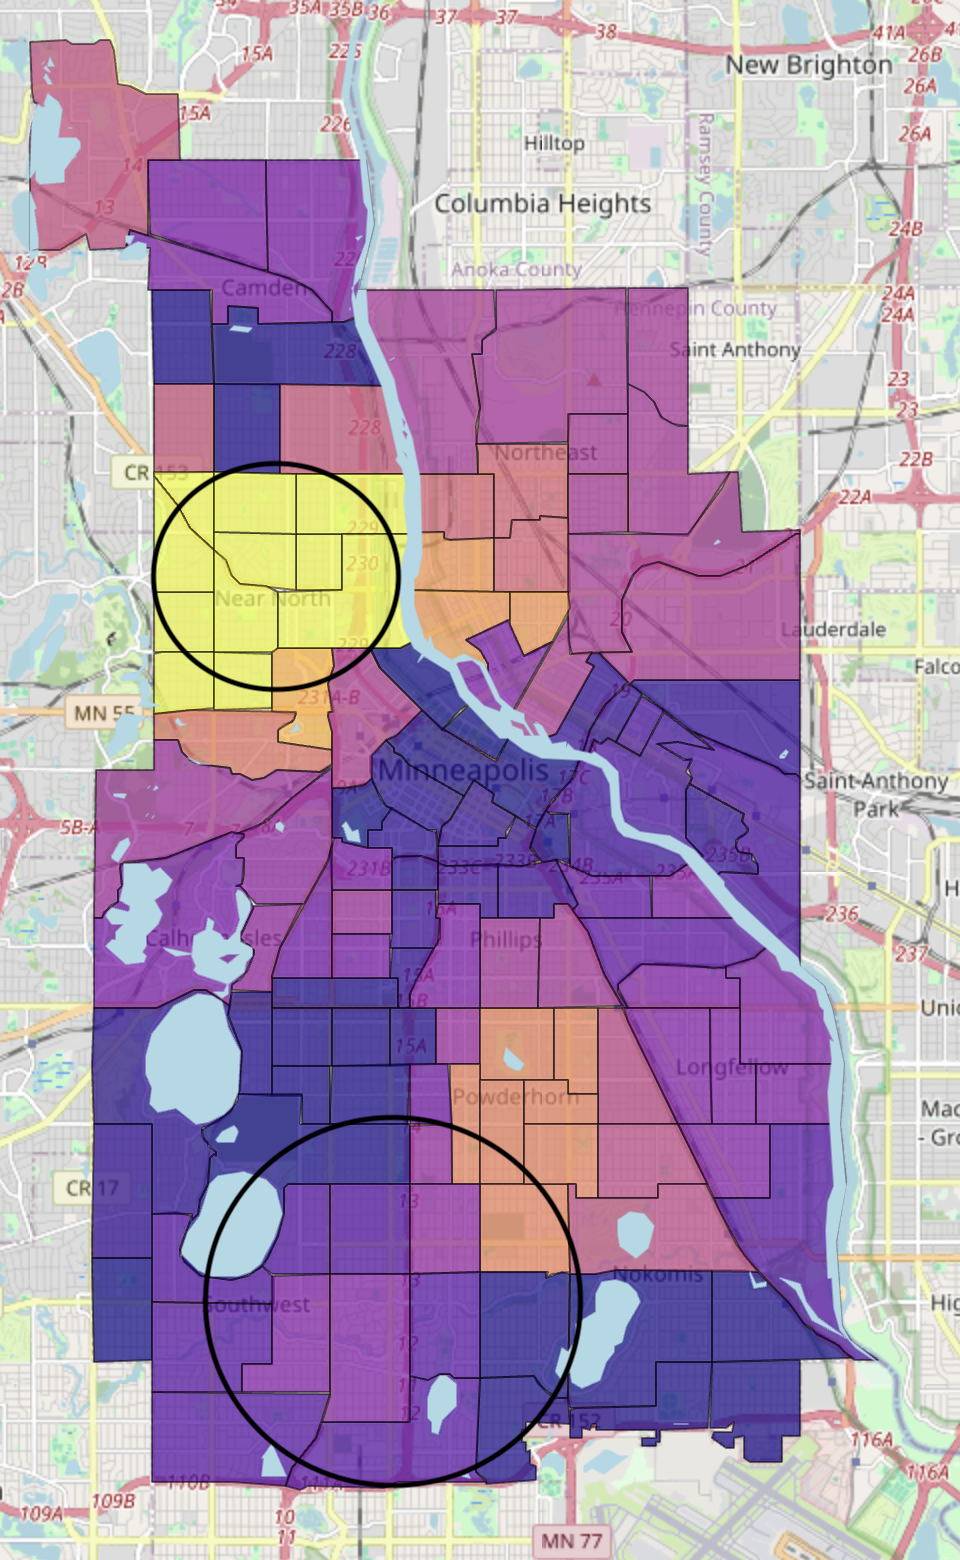
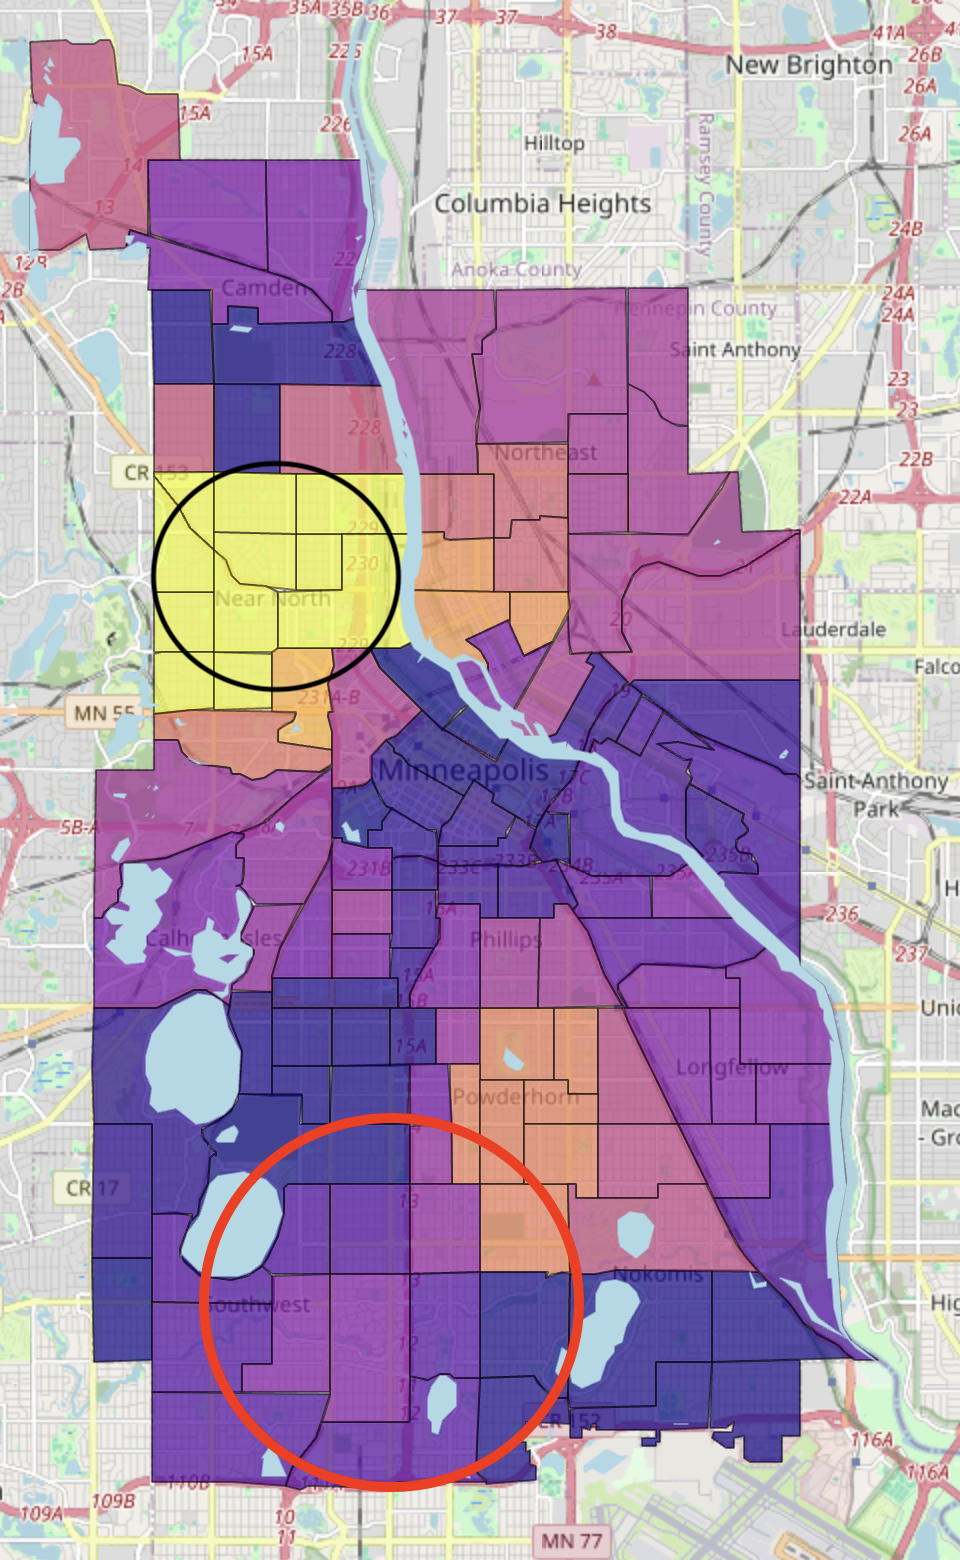
Similarly, we can observe these patterns when comparing levels of air pollution from factories.
Neighborhoods with a lot of previous racial covenants, ones that were deemed as desirable and worthy of investment, tend to have no factories planted within its vicinity. They tend to be exposed to zero emissions of PM2.5 from nearby factories.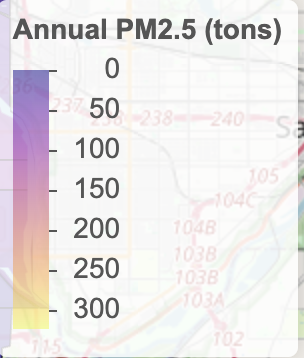
On the other hand, in the Near North neighborhood (no racial covenants and C-D HOLC grade), one of Minneapolis’ communities with the biggest BIPOC population, are exposed to severely high levels of PM2.5 emissions. This is because within their area, there are around 15 air emitting factories–including the Hennepin Energy Recovery Center.
Social Vulnerability vs. Air Pollution
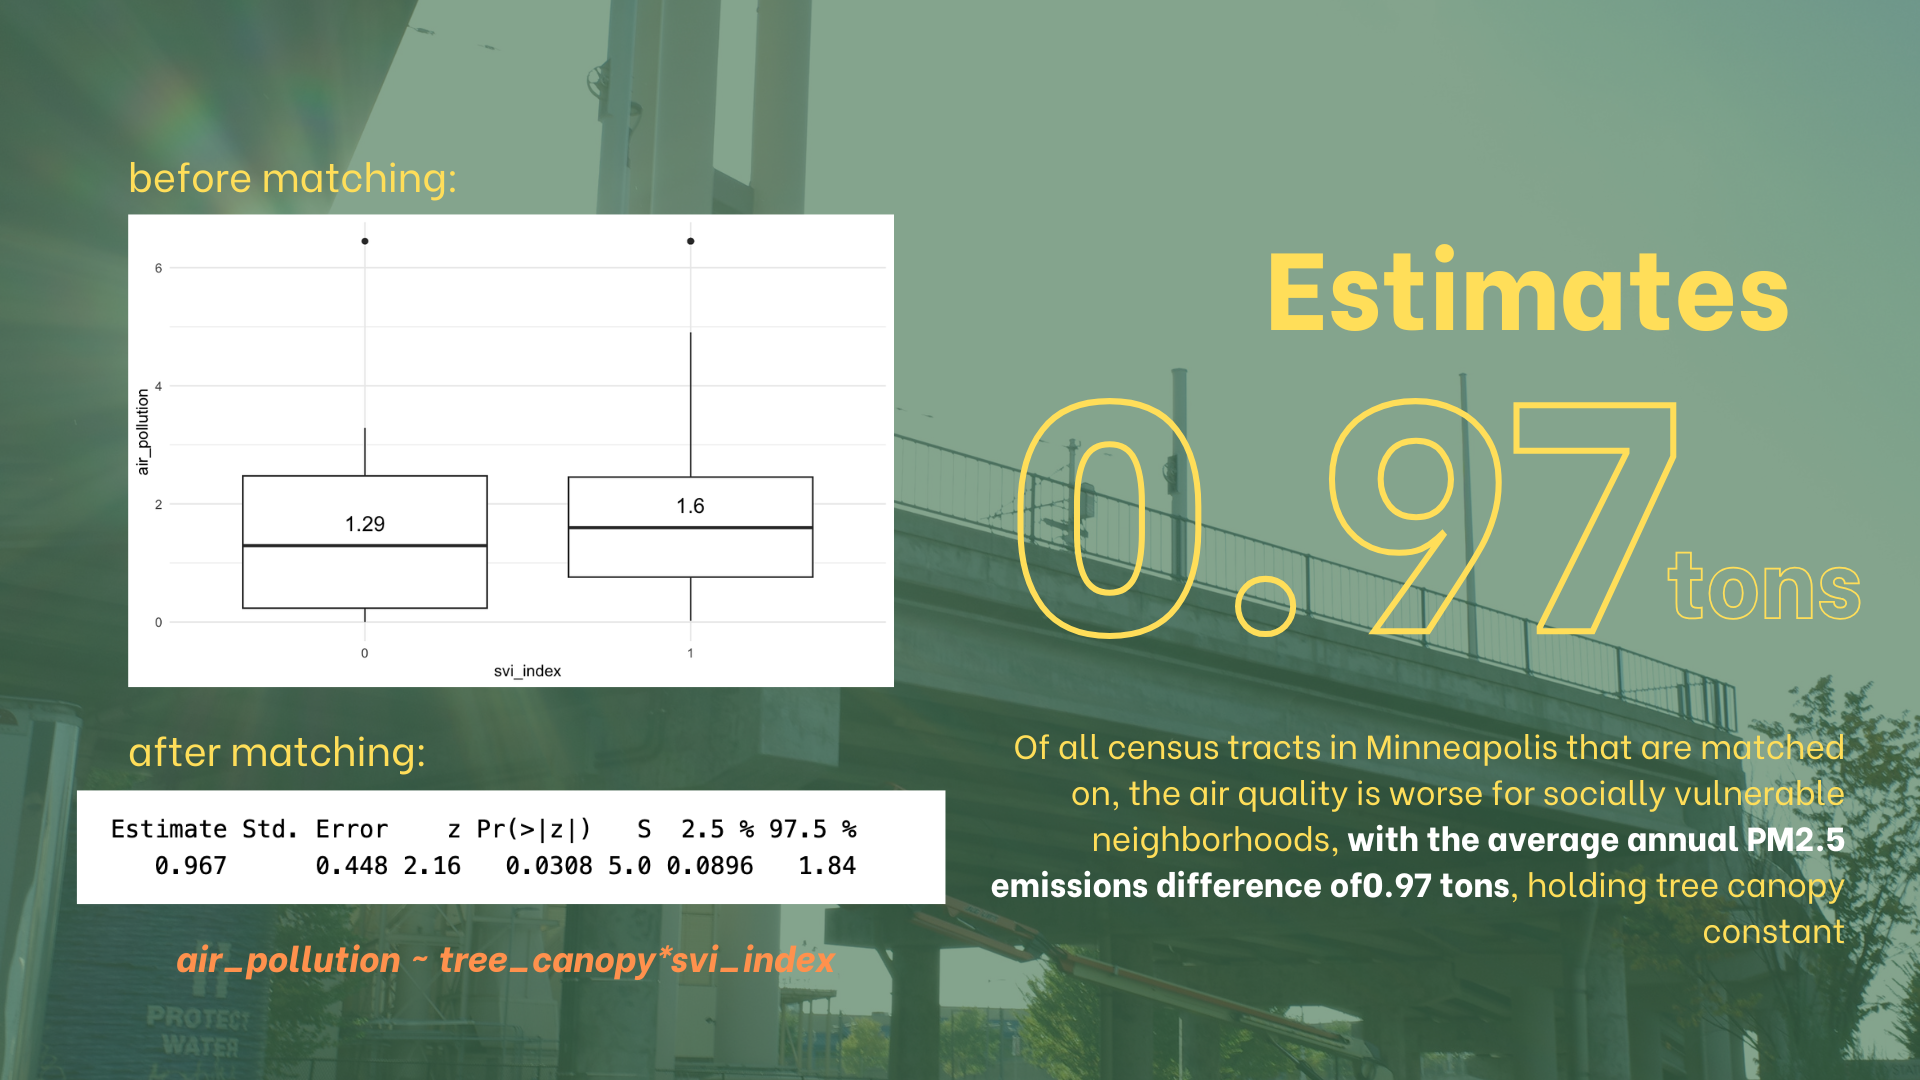
In our analysis, we observed that census tracts with higher social vulnerability are exposed to 0.96 tons of PM2.5 more than less vulnerable areas.
Social Vulnerability vs. Land Surface Temperature
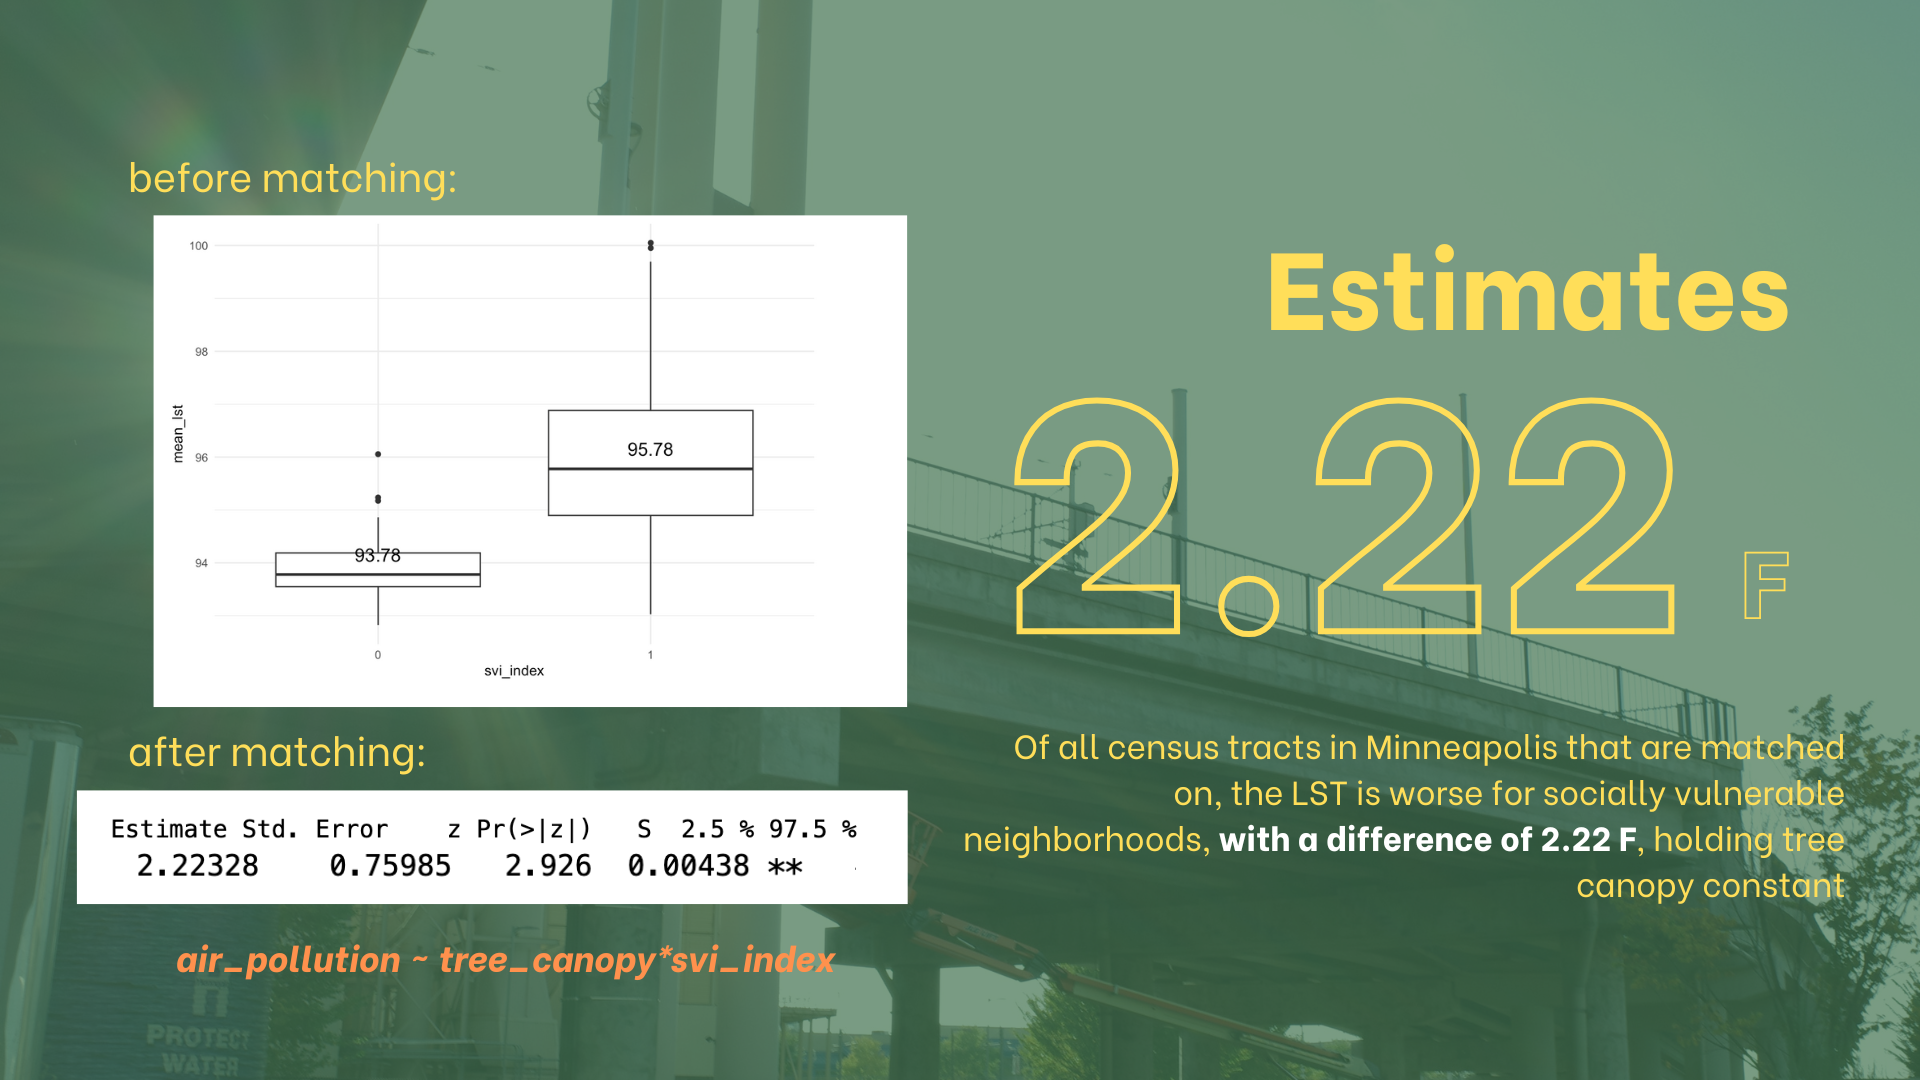
In the same vein, our model revealed that census tracts with higher social vulnerability had a mean land surface temperature that were 2.22°F higher than less vulnerable areas.
Click here for the full statistical report!
Social Vulnerability vs. Climate Change
From our findings, it was clear that socially vulnerable neighborhoods (high poverty levels and minority population) are more exposed to air pollution and higher temperatures.